Building geological/static models is a stepwise process and due to its complexity managed by specific software, whereas the modeling software PETREL has been applied to build this Rotliegend as well as the Hauptdolomit (Ca2) models located in Germany. Prior to the data processing all available logs and maps had to be digitized and imported into the project database. Fault models were created, cell geometry set, stratigraphy and zoning of various marker horizons determined considering a simplified fault strike and dip due to missing seismic and subsequent interpretation thereof. Finally, porosity and permeability property models have been generated to define the reservoir specific gas in place and to describe fluid flow within the porous media. The so-created static models have been used for adaptation to the needs of reservoir simulation and further improved by interactive feedback loops from dynamic simulation to the static modeler and vice versa.
The Rotliegend geological model was originated as part of the MPTII study [GRÄßEL, 2009] and later on modified to implement first reservoir simulation results [DOMINIK, 2010].
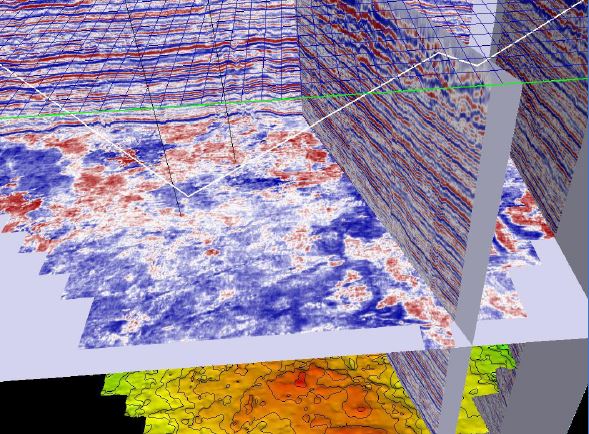
The modeling process was initiated by the import of all well coordinates and deviation surveys (MD, TVDSS) to define the stratigraphic sequence marked with well tops and key horizons. Supplemented by mud and core samples a lithology log was compiled and gamma ray (GR) log correlated. The Upper Rotliegend structure map was imported with UTM transformed coordinates and converted into a surface map utilizing the well tops for interpolation correction. For modeling purpose of the Lower Rotliegend the available top map was copied and depth shifted to match the Rotliegend and Carboniferous horizon markers. Finally, the surface maps have been smoothed and peaks especially toward the boundaries eliminated or manually adjusted.
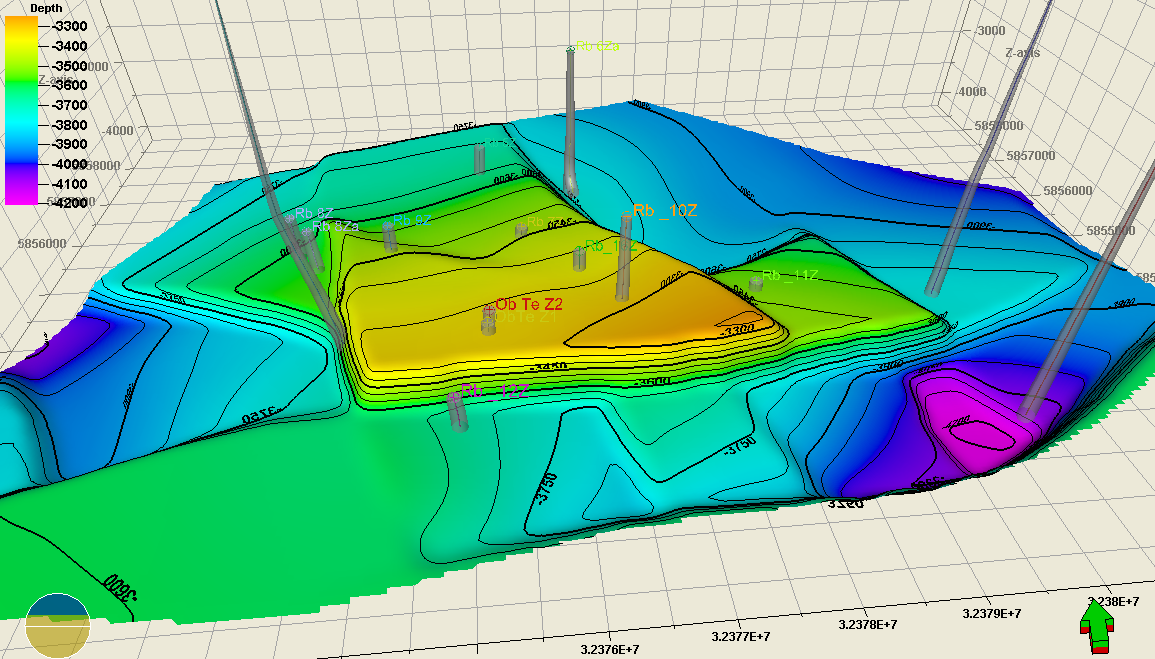
Similar top maps have been generated for a) Hauptdolomit (Ca2), b) Lower Rotliegend and c) Carboniferous and hence converted into surfaces. In combination with late Permian developed faults these horizons led to five compartments plus the southern deep Graben within the Rütenbrock gas field. The structural model process has been interactively optimized within the geo-engineering team to minimize potential computing (CPU) time during reservoir simulation later on.
The geological compartments have been defined based on vertical assumed faults due to missing information or seismic data. Implemented trend lines were used for the grid orientation prior to generation of the skeleton grid following the pre-dominant NW-SSE trend. By choosing zigzag faults major objective was gained to build an orthogonal orientated grid. Further objective to limit the grid cell amount without losing major geological events or flow control limits was achieved by setting the X-Y cell size to 100 x 100 m.
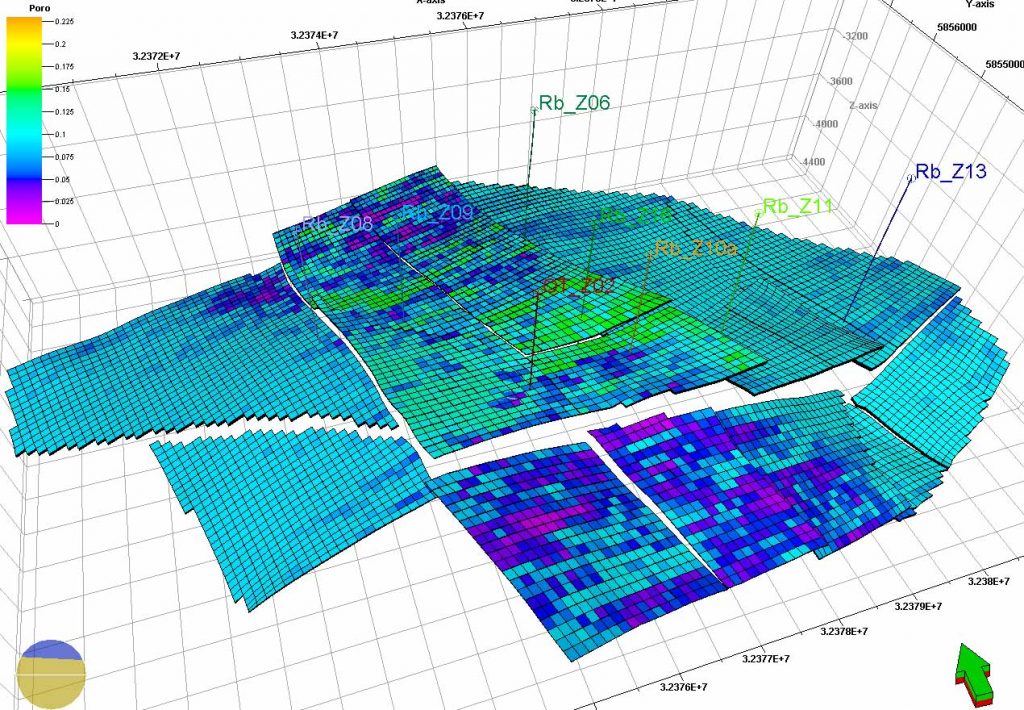
Top Hauptdolomit and Upper Rotliegend horizons have been defined as conformable types, but the Base Rotliegend sandstone modeled as a discontinuous horizon considering erosion within the Lower Rotliegend [GELUK, 2005]. Due to missing stratigraphic or diagenesis information no subunits were introduced in the Upper Rotliegend, whereas the Lower Rotliegend was subdivided into the three subunits: 1) Base Rotliegend sandstone, 2) Spilite and 3) Mudstone. A parallel layering to the zone top (follow top) was chosen in accordance with the clastic system and its successive filling within the depositional area. Due to the fluvial dominated deposition of the Upper Rotliegend with the known transport direction from SSE an additional reference surface was implemented to honor the orientation of the sedimentation during depositional time [EINSELE, 2000]. The subunits thickness was managed by the well pay zones taking into account a minimum of one meter to avoid potential iteration problems by fluid transfer from big into small cells and vice versa during reservoir simulation later on.
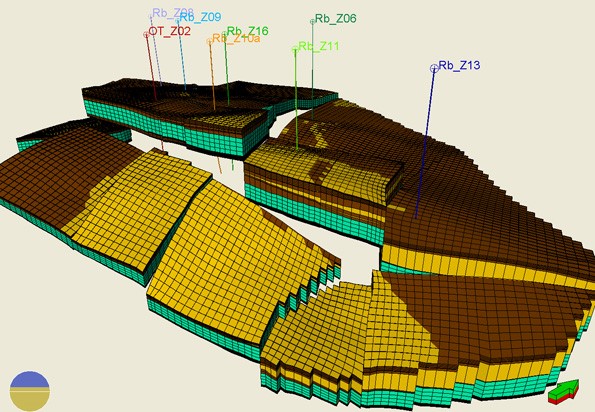
Finally, the static model was generated with 1 m layer thickness both for the Upper and Lower Rotliegend reservoirs, whereas the interbedded volcanics (turquoise marker) and Spilite/Mudstone (dark brown marker) have layers of 10 and 15 m respectively, due to their non-relevant function during reservoir simulation. The geological model was quality checked using the processes ‘cell angles’ (orthogonal variations), ‘cell volumes’ (min/max histogram) and ‘cell inside-out’ (deviations from “0”). The final grid contained 1,637,916 cells (119x74x186) in total as shown above.
The modeling process was initiated by the import of all well coordinates and deviation surveys (MD, TVDSS) to define the stratigraphic sequence marked with well tops and key horizons. Supplemented by mud and core samples a lithology log was compiled and gamma ray (GR) log correlated. The Upper Rotliegend structure map was imported with UTM transformed coordinates and converted into a surface map utilizing the well tops for interpolation correction. For modeling purpose of the Lower Rotliegend the available top map was copied and depth shifted to match the Rotliegend and Carboniferous horizon markers. Finally, the surface maps have been smoothed and peaks especially toward the boundaries eliminated or manually adjusted.
Similar top maps have been generated for a) Hauptdolomit (Ca2), b) Lower Rotliegend and c) Carboniferous and hence converted into surfaces. In combination with late Permian developed faults these horizons led to five compartments plus the southern deep Graben within the Rütenbrock gas field. The structural model process has been interactively optimized within the geo-engineering team to minimize potential computing (CPU) time during reservoir simulation later on.
The geological compartments have been defined based on vertical assumed faults due to missing information or seismic data. Implemented trend lines were used for the grid orientation prior to generation of the skeleton grid following the pre-dominant NW-SSE trend. By choosing zigzag faults major objective was gained to build an orthogonal orientated grid. Further objective to limit the grid cell amount without losing major geological events or flow control limits was achieved by setting the X-Y cell size to 100 x 100 m.
Top Hauptdolomit and Upper Rotliegend horizons have been defined as conformable types, but the Base Rotliegend sandstone modeled as a discontinuous horizon considering erosion within the Lower Rotliegend [GELUK, 2005]. Due to missing stratigraphic or diagenesis information no subunits were introduced in the Upper Rotliegend, whereas the Lower Rotliegend was subdivided into the three subunits: 1) Base Rotliegend sandstone, 2) Spilite and 3) Mudstone. A parallel layering to the zone top (follow top) was chosen in accordance with the clastic system and its successive filling within the depositional area. Due to the fluvial dominated deposition of the Upper Rotliegend with the known transport direction from SSE an additional reference surface was implemented to honor the orientation of the sedimentation during depositional time [EINSELE, 2000]. The subunits thickness was managed by the well pay zones taking into account a minimum of one meter to avoid potential iteration problems by fluid transfer from big into small cells and vice versa during reservoir simulation later on.
Finally, the static model was generated with 1 m layer thickness both for the Upper and Lower Rotliegend reservoirs, whereas the interbedded volcanics (turquoise marker) and Spilite/Mudstone (dark brown marker) have layers of 10 and 15 m respectively, due to their non-relevant function during reservoir simulation. The geological model was quality checked using the processes ‘cell angles’ (orthogonal variations), ‘cell volumes’ (min/max histogram) and ‘cell inside-out’ (deviations from “0”). The final grid contained 1,637,916 cells (119x74x186) in total as shown above.